Install Prometheus in TKG cluster

Reading Time: 3 mins

Overview

Prometheus is an open-source systems monitoring and alerting toolkit. Tanzu Kubernetes Grid includes signed binaries for Prometheus that you can deploy on Tanzu Kubernetes clusters to monitor cluster health and services. In this post, I will explain the steps to deploy Prometheus on a Tanzu Kubernetes (workload) cluster. For more detailed, refer to official doc

Pre reqs:

  •  Bootstrap machine with the following installed: Tanzu CLI, kubectl installed as mentioned here
  •  Tanzu Kubernetes Grid management cluster and workload cluster running on vSphere, Amazon EC2, or Azure, with the package repository installed. For this demo, I have deployed TKG on Azure.
  • Cert-manager:  click here to get the detailed steps to install cert-manager packages from TMC
  • Contour: click here to get the detailed steps to install Contour packages from TMC

Prepare config file:

  • Create a yaml file with below config. In this demo, I will be using nodes local storage
storageclass
kind: StorageClass
apiVersion: storage.k8s.io/v1
metadata:
  name: local-storage
provisioner: kubernetes.io/no-provisioner
volumeBindingMode: WaitForFirstConsumer
Prepare the config
# Get the admin credentials of the workload cluster into which you want to deploy Prometheus. In this case, capv-workload is workload cluster: 

$ tanzu cluster kubeconfig get capv-workload --admin

# Set the context of kubectl to the cluster

$ kubectl config use-context capv-workload-admin@capv-workload

# Retrieve the version of the available package

$ tanzu package available list prometheus.tanzu.vmware.com -A

# Retrieve the template of the Prometheus package:

image_url=$(kubectl -n tanzu-package-repo-global get packages prometheus.tanzu.vmware.com.2.27.0+vmware.1-tkg.1 --kubeconfig ~/.kube/config-tkg -o jsonpath='{.spec.template.spec.fetch[0].imgpkgBundle.image}')

imgpkg pull -b $image_url -o /tmp/prometheus-package-2.27.0+vmware.1-tkg.1

cp /tmp/prometheus-package-2.27.0+vmware.1-tkg.1/config/values.yaml prometheus-data-values.yaml
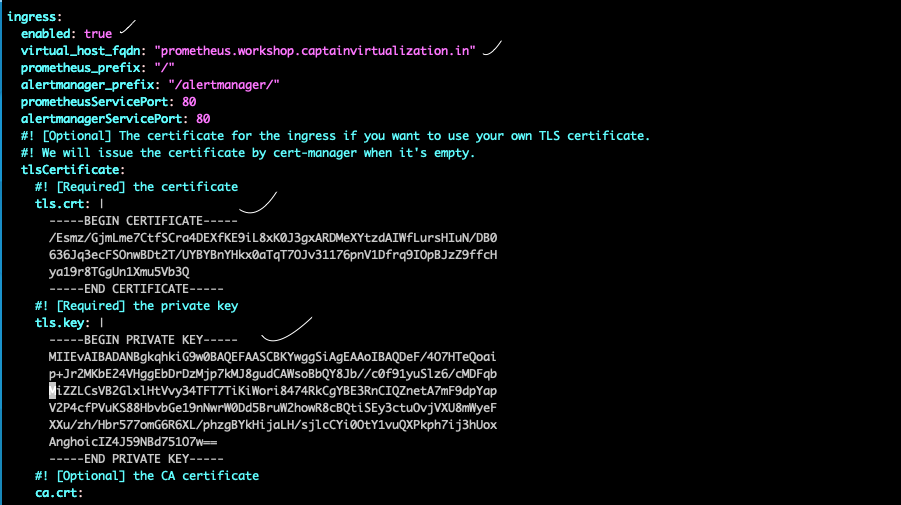
  • Edit the generated config file: prometheus-data-values.yaml to change the values as shown below.

  • Ex: I have changed the domain to prometheus.workshop.captainvirtualization.in and added certificates, key

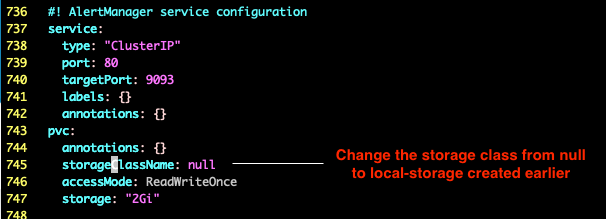
  • Under Alert Manager Service configuration: Provide storageClassName, this should be the same as we mentioned in above storageclass.yaml file.

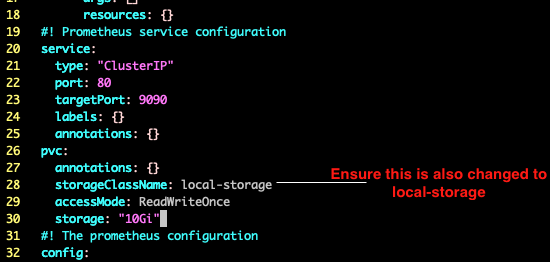
  • Under Prometheus service configuration: Provide storageClassName, this should be the same as we mentioned in above storageclass.yaml file and change the storage to “10Gi”.


Create NS and storageclass
kubectl create ns tanzu-system-monitoring

kubectl apply -f storageclass.yaml -n tanzu-system-monitoring
storageclass.storage.k8s.io/local-storage created
  • Create two persistent volumes.
    1. Prometheus service configuration
    2. Alert Manager service configuration

Note: Login to worker node(s) of workload cluster and create empty directory pv1, pv2 under /data/volumes/ and also provide the host name(s) under values in below file.

persistent volume yaml file
apiVersion: v1
kind: PersistentVolume
metadata:
  name: pv-1
spec:
  capacity:
    storage: 50Gi
  accessModes:
  - ReadWriteOnce
  persistentVolumeReclaimPolicy: Retain
  storageClassName: local-storage
  local:
    path: /data/volumes/pv1
  nodeAffinity:
    required:
      nodeSelectorTerms:
      - matchExpressions:
        - key: kubernetes.io/hostname
          operator: In
          values:
          - capv-workload-md-0-v1-22-5-vmware-1-oqqxb-gs6pv  ### To be changed
---
apiVersion: v1
kind: PersistentVolume
metadata:
  name: pv-2
spec:
  capacity:
    storage: 15Gi
  accessModes:
  - ReadWriteOnce
  persistentVolumeReclaimPolicy: Retain
  storageClassName: local-storage
  local:
    path: /data/volumes/pv2
  nodeAffinity:
    required:
      nodeSelectorTerms:
      - matchExpressions:
        - key: kubernetes.io/hostname
          operator: In
          values:
          - capv-workload-md-0-v1-22-5-vmware-1-oqqxb-gs6pv ### To be changed
create persistent volumes
$ kubectl apply -f pv.yaml -n tanzu-system-monitoring 
persistentvolume/pv-1 created
persistentvolume/pv-2 created

Install prometheus

$ tanzu package install prometheus --package-name prometheus.tanzu.vmware.com --version 2.27.0+vmware.1-tkg.1 --values-file prometheus-data-values.yaml 

\ Installing package 'prometheus.tanzu.vmware.com'
/ Getting package metadata for 'prometheus.tanzu.vmware.com'
- Creating service account 'prometheus-default-sa'
- Creating cluster admin role 'prometheus-default-cluster-role'
- Creating cluster role binding 'prometheus-default-cluster-rolebinding'
/ Creating secret 'prometheus-default-values'
- Creating package resource
| Waiting for 'PackageInstall' reconciliation for 'prometheus'
- 'PackageInstall' resource install status: Reconciling


 Added installed package 'prometheus'


## Validate the pods

kubectl get pods -n tanzu-system-monitoring 
NAME                                             READY   STATUS    RESTARTS   AGE
alertmanager-7769c8b958-g5knr                    1/1     Running   0          2m11s
prometheus-cadvisor-chpmd                        1/1     Running   0          2m10s
prometheus-kube-state-metrics-6996d9b4dd-nbc5m   1/1     Running   0          2m10s
prometheus-node-exporter-mng97                   1/1     Running   0          2m9s
prometheus-node-exporter-wdxkm                   1/1     Running   0          2m9s
prometheus-pushgateway-7f86f4c4c6-5qt68          1/1     Running   0          2m9s
prometheus-server-7bc49686b9-58lt4               2/2     Running   0          2m9s

## Validate the pvc

$ kubectl get pvc -A 
NAMESPACE                 NAME                STATUS   VOLUME   CAPACITY   ACCESS MODES   STORAGECLASS    AGE
tanzu-system-monitoring   alertmanager        Bound    pv-2     15Gi       RWO            local-storage   42s
tanzu-system-monitoring   prometheus-server   Bound    pv-1     50Gi       RWO            local-storage   42s

## Validate PV

kubectl get pv -A 
NAME   CAPACITY   ACCESS MODES   RECLAIM POLICY   STATUS   CLAIM                                       STORAGECLASS    REASON   AGE
pv-1   50Gi       RWO            Retain           Bound    tanzu-system-monitoring/prometheus-server   local-storage            15m
pv-2   15Gi       RWO            Retain           Bound    tanzu-system-monitoring/alertmanager        local-storage            15m
  • Collect the External IP of envoy load balancer
services
$ kubectl get svc -n tanzu-system-ingress 
NAME      TYPE           CLUSTER-IP       EXTERNAL-IP     PORT(S)                      AGE
contour   ClusterIP      100.65.225.165   <none>          8001/TCP                     35m
envoy     LoadBalancer   100.70.82.66     40.81.252.240   80:31587/TCP,443:32070/TCP   35m
  • Create a DNS record in hosted zone or local host file (/etc/hosts), by mapping the fqdn provided in prometheus-data-values.yaml to above load balancer IP.
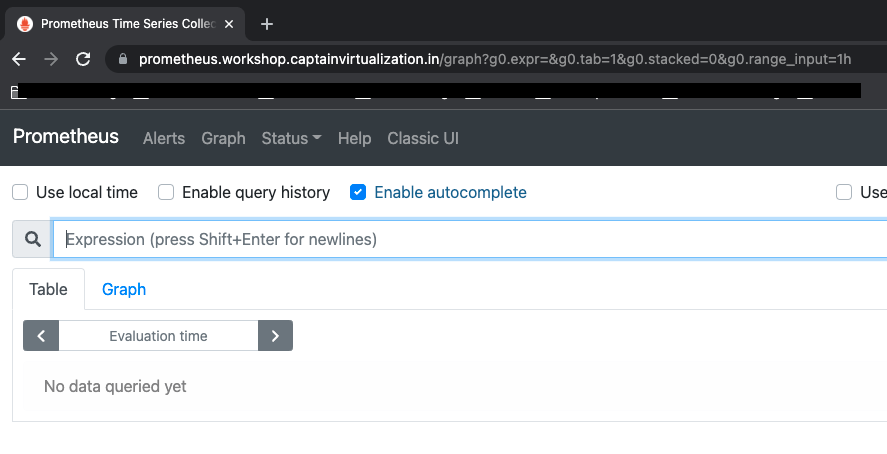
  • Access the prometheus fqdn in browser