Install Grafana in TKG Cluster

Reading Time: 4 mins

Overview:

Grafana is open-source software that allows you to visualize and analyze metrics data collected by Prometheus on your clusters. Tanzu Kubernetes Grid includes a Grafana package that you can deploy on your Tanzu Kubernetes clusters. In this post, I will explain the steps to deploy Grafana on a Tanzu Kubernetes (workload) cluster. For more detailed, refer to official doc

Pre reqs:

  •  Bootstrap machine with the following installed: Tanzu CLI, kubectl installed as mentioned here
  •  Tanzu Kubernetes Grid management cluster and workload cluster running on vSphere, Amazon EC2, or Azure, with the package repository installed. For this demo, I have deployed TKG on Azure.
  • Cert-manager:  click here to get the detailed steps to install cert-manager packages from TMC
  • Contour: click here to get the detailed steps to install Contour packages from TMC
  • Prometheus: click here to get the detailed steps to install Prometheus

Prepare config file:

  • Set the content to workload cluster and fetch the Grafana package version:
# Get the admin credentials of the workload cluster into which you want to deploy Grafana. In this case, capv-workload is workload cluster: 

$ tanzu cluster kubeconfig get capv-workload --admin

# Set the context of kubectl to the cluster

$ kubectl config use-context capv-workload-admin@capv-workload

# Retrieve the version of the available package

$ tanzu package available list grafana.tanzu.vmware.com -A 
/ Retrieving package versions for grafana.tanzu.vmware.com...
  NAME                      VERSION               RELEASED-AT                    NAMESPACE
  grafana.tanzu.vmware.com  7.5.7+vmware.1-tkg.1  2021-05-19 18:00:00 +0000 UTC  tanzu-package-repo-global
  grafana.tanzu.vmware.com  7.5.7+vmware.2-tkg.1  2021-05-19 18:00:00 +0000 UTC  tanzu-package-repo-global
  • Create a yaml file with below config and name it as storageclass.yaml. In this demo, I will be using node local storage
storageclass
kind: StorageClass
apiVersion: storage.k8s.io/v1
metadata:
  name: local-storage
provisioner: kubernetes.io/no-provisioner
volumeBindingMode: WaitForFirstConsumer
Prepare the config for Grafana
# Retrieve the template of the Prometheus package:

image_url=$(kubectl -n tanzu-package-repo-global get packages grafana.tanzu.vmware.com.7.5.7+vmware.1-tkg.1 -o jsonpath='{.spec.template.spec.fetch[0].imgpkgBundle.image}')

imgpkg pull -b $image_url -o /tmp/grafana-package-7.5.7+vmware.1-tkg.1

cp /tmp/grafana-package-7.5.7+vmware.1-tkg.1/config/values.yaml grafana-data-values.yaml
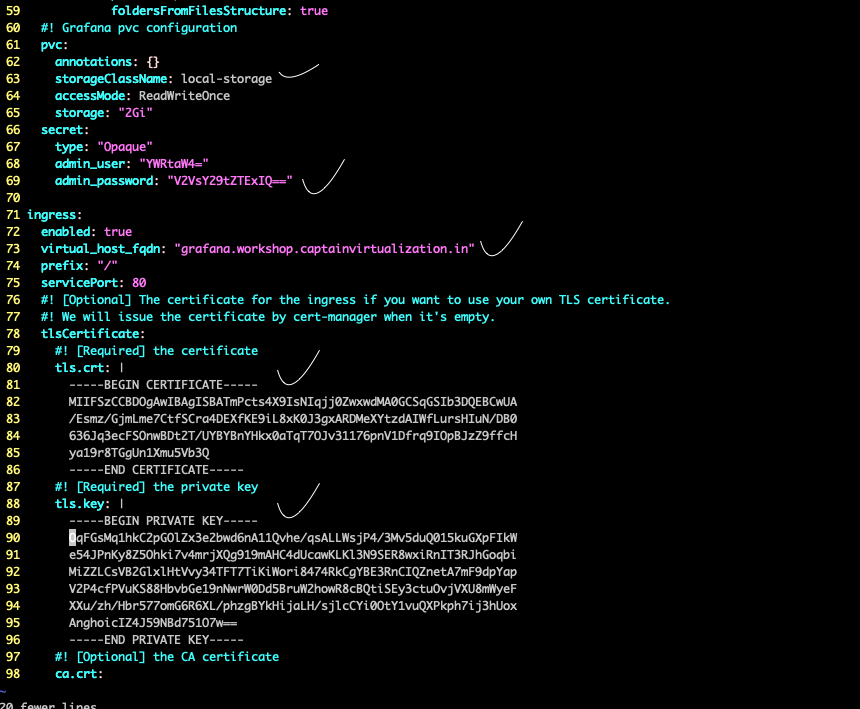
  • Edit the generated config file: grafana-data-values.yaml to change the values as shown below
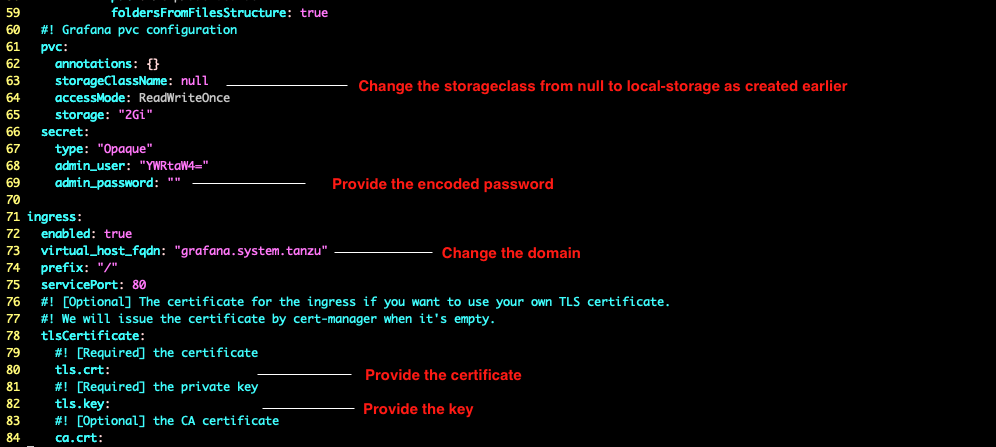
Ex:

    1. I have changed the fqdn to prometheus.workshop.captainvirtualization.in and added certificate, key
    2. Added encoded admin password using the command: echo -n “Welcome11!” | base64
    3. Changed StorageClassName from null to name (local-storage) mentioned in above storageclass.yaml file

Create NS and storageclass
$ kubectl create ns tanzu-system-dashboards
namespace/tanzu-system-dashboards created

$ kubectl apply -f storageclass.yaml -n tanzu-system-dashboards
# Get Storageclass info

$ kubectl get StorageClass -A
NAME                PROVISIONER                    RECLAIMPOLICY   VOLUMEBINDINGMODE      ALLOWVOLUMEEXPANSION   AGE

local-storage       kubernetes.io/no-provisioner   Delete          WaitForFirstConsumer   false                  3h5m
  • Create a persistent volume

Note: Login to worker node(s) of workload cluster and create empty directory pv3 under /data/volumes/ and also provide the host name(s) under values in below file.

persistent-volume
apiVersion: v1
kind: PersistentVolume
metadata:
  name: pv-3
spec:
  capacity:
    storage: 10Gi
  accessModes:
  - ReadWriteOnce
  persistentVolumeReclaimPolicy: Retain
  storageClassName: local-storage
  local:
    path: /data/volumes/pv3
  nodeAffinity:
    required:
      nodeSelectorTerms:
      - matchExpressions:
        - key: kubernetes.io/hostname
          operator: In
          values:
          - capv-workload-md-0-v1-22-5-vmware-1-oqqxb-gs6pv   ### To be changed
## Create persistent volume: pv-3

$ kubectl apply -f pv-grafana.yaml -n tanzu-system-dashboards
persistentvolume/pv-3 created

# Created PV should be in available state

$ kubectl get pv
NAME   CAPACITY   ACCESS MODES   RECLAIM POLICY   STATUS      CLAIM                                       STORAGECLASS    REASON   AGE
pv-1   50Gi       RWO            Retain           Bound       tanzu-system-monitoring/prometheus-server   local-storage            46m
pv-2   15Gi       RWO            Retain           Bound       tanzu-system-monitoring/alertmanager        local-storage            46m
pv-3   10Gi       RWO            Retain           Available                                               local-storage            2m14s

Install Grafana

Install and validate
$ tanzu package install grafana --package-name grafana.tanzu.vmware.com --version 7.5.7+vmware.1-tkg.1 --values-file grafana-data-values.yaml 
\ Installing package 'grafana.tanzu.vmware.com'
| Getting package metadata for 'grafana.tanzu.vmware.com'
- Creating service account 'grafana-default-sa'
- Creating cluster admin role 'grafana-default-cluster-role'
- Creating cluster role binding 'grafana-default-cluster-rolebinding'
- Creating secret 'grafana-default-values'
- Creating package resource
| Waiting for 'PackageInstall' reconciliation for 'grafana'
| 'PackageInstall' resource install status: Reconciling


 Added installed package 'grafana'


# Validate the pods

$ kubectl get pods -n tanzu-system-dashboards
NAME                      READY   STATUS    RESTARTS   AGE
grafana-ffb9f9997-6sgn5   2/2     Running   0          3h53m

# Validate PVC

kubectl get pvc  
NAMESPACE                 NAME                STATUS   VOLUME   CAPACITY   ACCESS MODES   STORAGECLASS    AGE
tanzu-system-dashboards   grafana-pvc         Bound    pv-3     10Gi       RWO            local-storage   3h54m
tanzu-system-monitoring   alertmanager        Bound    pv-2     15Gi       RWO            local-storage   4h29m
tanzu-system-monitoring   prometheus-server   Bound    pv-1     50Gi       RWO            local-storage   4h29m

# Validate PV

$ kubectl get pv 
NAME   CAPACITY   ACCESS MODES   RECLAIM POLICY   STATUS   CLAIM                                       STORAGECLASS    REASON   AGE
pv-1   50Gi       RWO            Retain           Bound    tanzu-system-monitoring/prometheus-server   local-storage            4h48m
pv-2   15Gi       RWO            Retain           Bound    tanzu-system-monitoring/alertmanager        local-storage            4h48m
pv-3   10Gi       RWO            Retain           Bound    tanzu-system-dashboards/grafana-pvc         local-storage            4h4m

# Get External Load balancer IP

kubectl get svc -n tanzu-system-dashboards
NAME      TYPE           CLUSTER-IP     EXTERNAL-IP     PORT(S)        AGE
grafana   LoadBalancer   100.69.226.7   20.204.203.49   80:31221/TCP   10m
  • Create a DNS record in hosted zone or local host file (/etc/hosts), by mapping the fqdn provided in grafana-data-values.yaml to above collected load balancer IP.

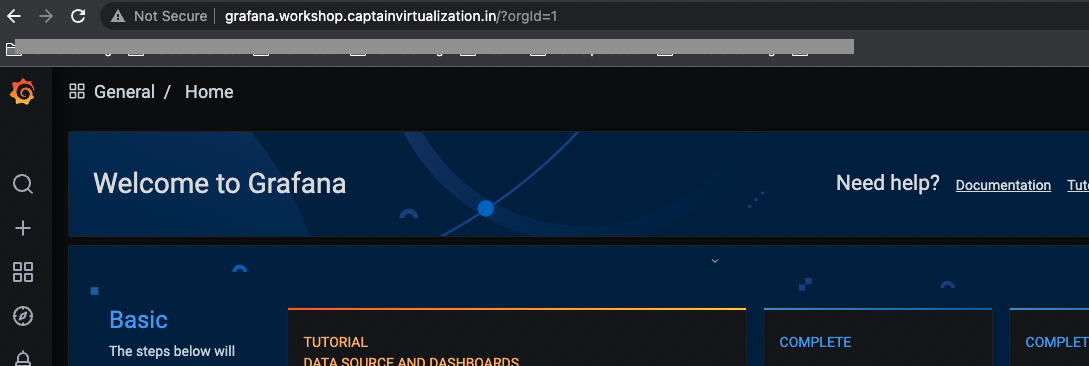
  • Access the prometheus fqdn in browser

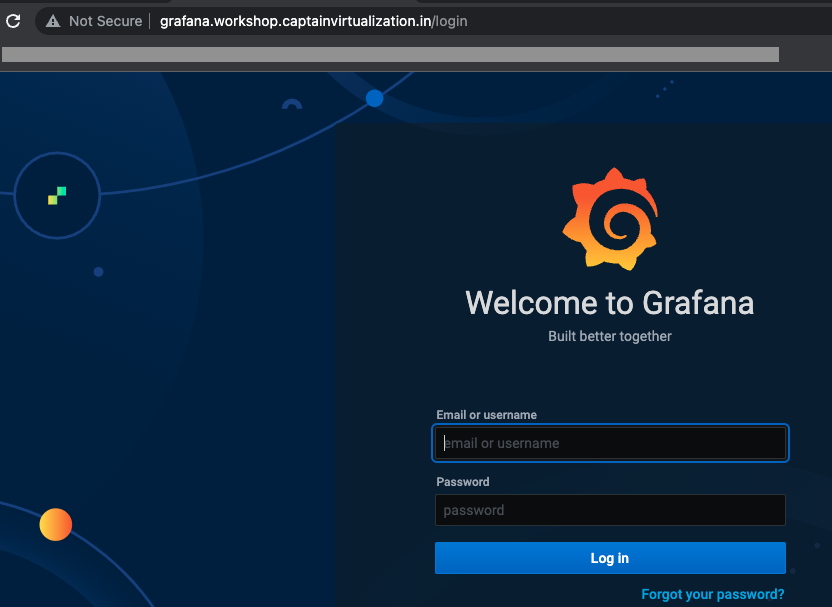
  • Credentials as mentioned in grafana-data-values.yaml file : Admin, Welcome11!

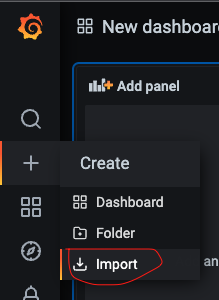
  • Once successfully logged in, navigate to Add (+) > Import as shown below

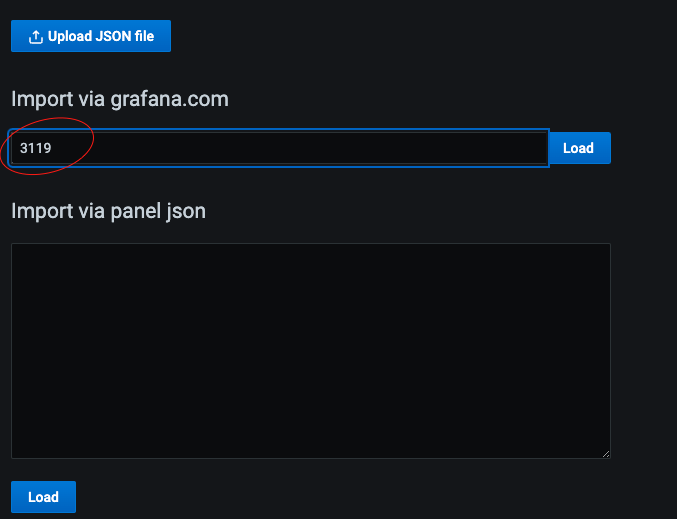
  • Type 3119 and click Load

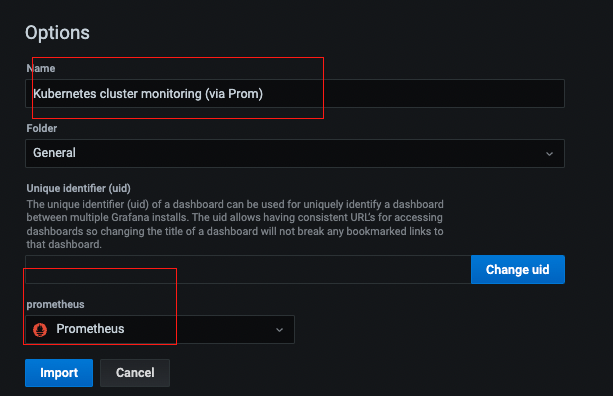
  • Verify the name and same can be changed too and select Prometheus from drop down of prometheus section
  • Import

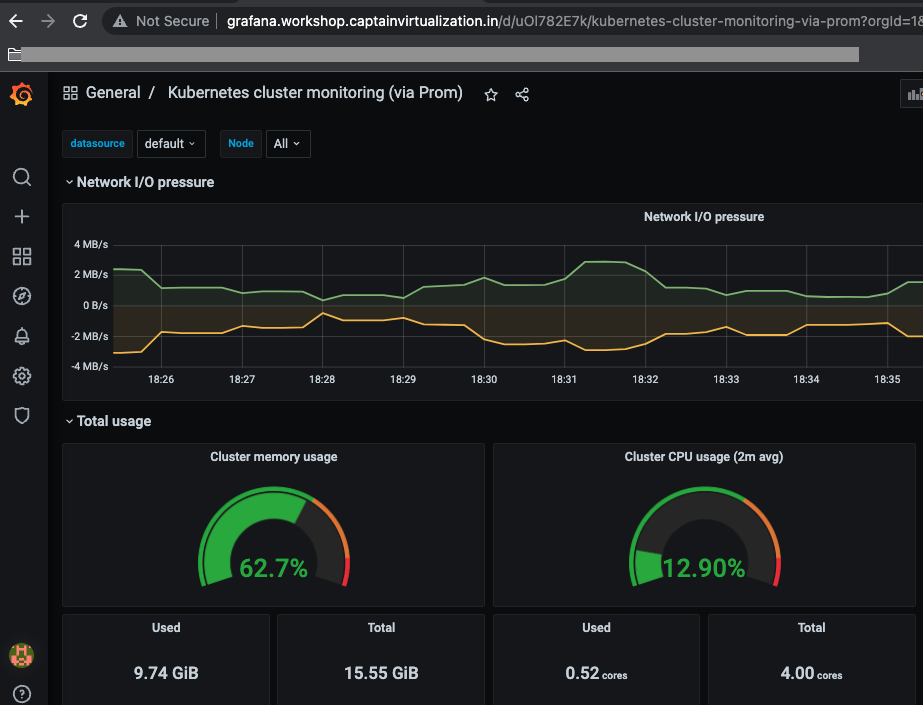
  • Here you go, the amazing grafana dashboards showing the resource utilisation of nodes, pods etc.. which can be customised in many different ways.